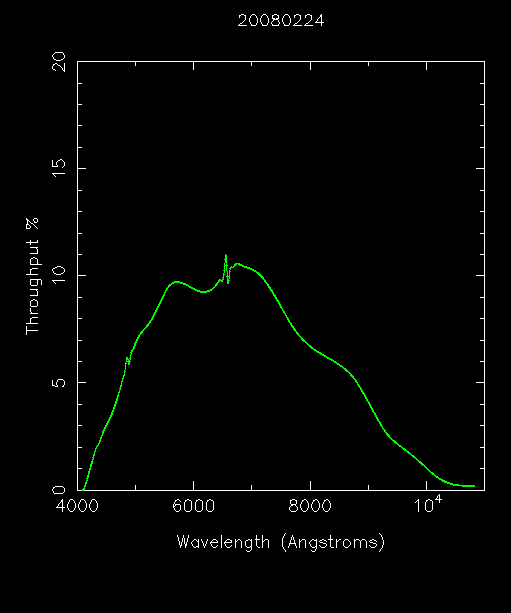
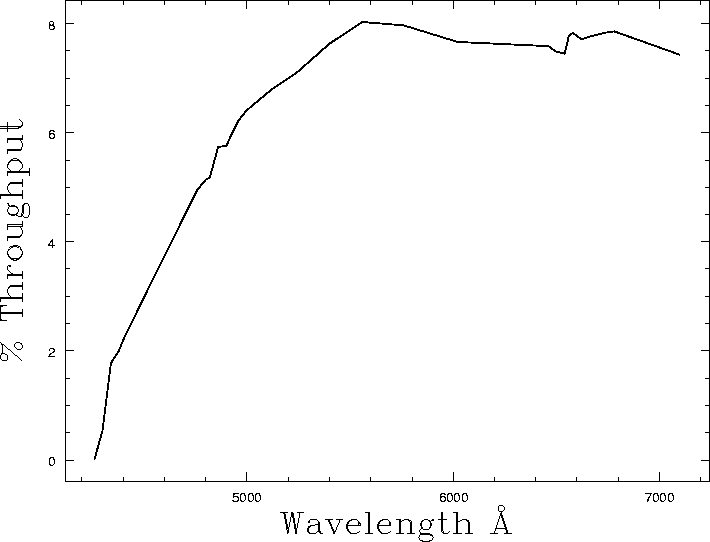
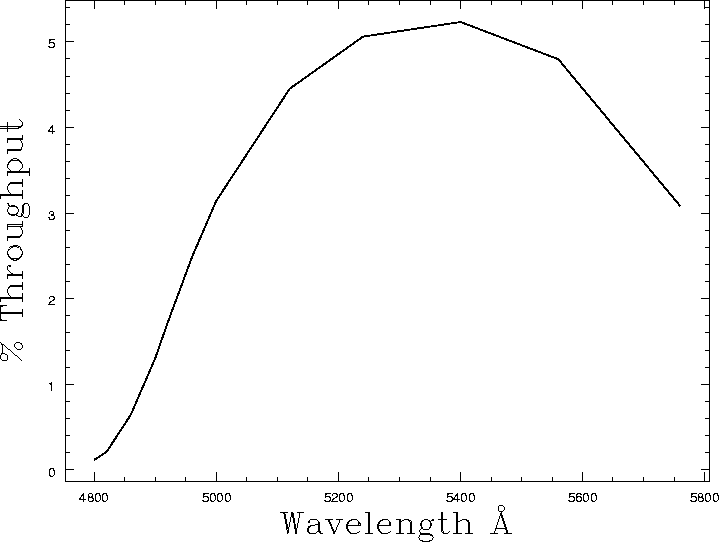
LRS Throughput
It is important for the PI to realize that due to the design of the HET the effective collecting area changes over a trajectory. Near the end of a trajectory the HET has half the collecting area in comparison to the middle of a trajectory. As such two medium length visits centered on middle of a track are sometimes more valuable than a single long visit. All Throughput estimates are based upon center of track throughputs.We have no imaging performance benchmarks yet because the depth depends so much on image quality and sky brightness.
Rough Estimates
These are sky noise dominated observations, so remember to scale by the sqrt(time). ALL S/N are per assuming 2x2 binning and are per resolution element.
| Configuration | Type of Object | Mag. | Time | S/N @ Wavelength |
|---|---|---|---|---|
| LRS_g1_2.0_GG385 | stellar/QSO | 20 | 1800 | 15-20 @ 6500 Å |
| LRS_g1_2.0_GG385 | stellar/QSO | 21 | 1800 | 3-8 @ 6500 Å |
| LRS_g1_2.0_GG385 | distant galaxy | 21 | 1800 | 9-14 @ 6500 Å |
| LRS_g2_2.0_GG385 | distant galaxy | 21 | 1800 | 4-9 @ 6500 Å |
| LRS_e2_1.0_E2F | stellar | 20 | 1800 | 8-12 @ 5000 Å |
To see the affect of changing exposure times in a moving aperature try the HET Filling Factor Calculator.
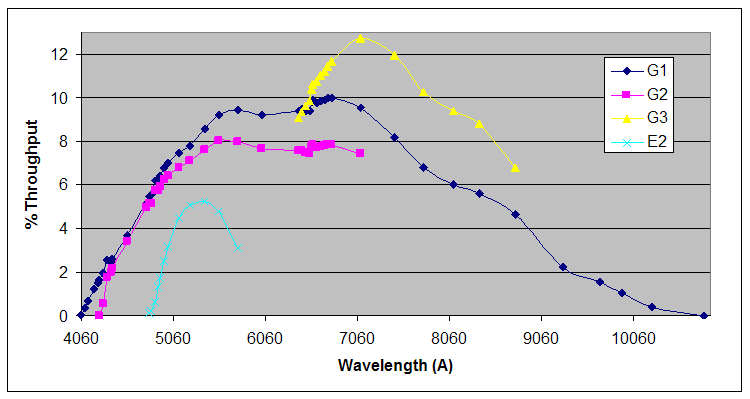
Throughput
In the following plots we give the throughput for each grating assuming a 9.2m telescope with a 3.713m obstruction, observed right at the center of the track (see fill factor information for more on this) and corrected to above the atmosphere using the KPNO extinction coefficients Click on the plot to download the text file used to generate the plot.
LRS g2
LRS g3 now defunct
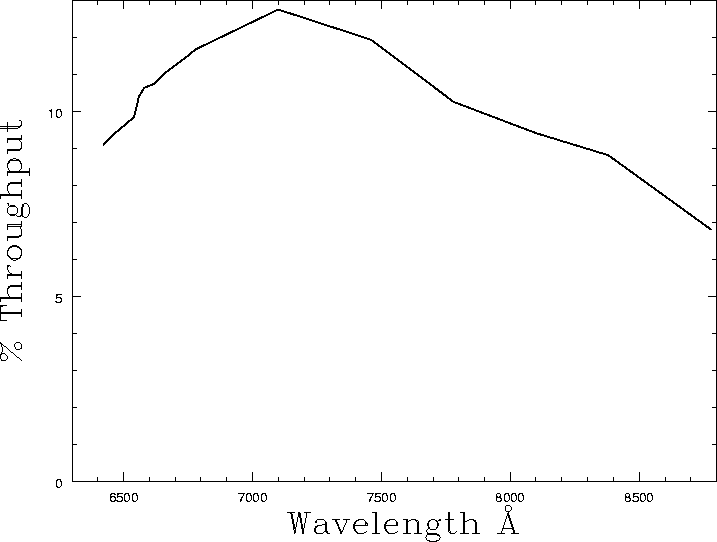
LRS e2
All LRS grisms
Using this Data