scipy.stats.boxcox
- scipy.stats.boxcox(x, lmbda=None, alpha=None)[source]
Return a positive dataset transformed by a Box-Cox power transformation.
Parameters: x : ndarray
Input array. Should be 1-dimensional.
lmbda : {None, scalar}, optional
If lmbda is not None, do the transformation for that value.
If lmbda is None, find the lambda that maximizes the log-likelihood function and return it as the second output argument.
alpha : {None, float}, optional
If alpha is not None, return the 100 * (1-alpha)% confidence interval for lmbda as the third output argument. Must be between 0.0 and 1.0.
Returns: boxcox : ndarray
Box-Cox power transformed array.
maxlog : float, optional
If the lmbda parameter is None, the second returned argument is the lambda that maximizes the log-likelihood function.
(min_ci, max_ci) : tuple of float, optional
See also
Notes
The Box-Cox transform is given by:
y = (x**lmbda - 1) / lmbda,  for lmbda > 0
    log(x),                  for lmbda = 0
boxcox requires the input data to be positive. Sometimes a Box-Cox transformation provides a shift parameter to achieve this; boxcox does not. Such a shift parameter is equivalent to adding a positive constant to x before calling boxcox.
The confidence limits returned when alpha is provided give the interval where:
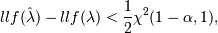
with llf the log-likelihood function and
 the chi-squared
function.
the chi-squared
function.References
G.E.P. Box and D.R. Cox, “An Analysis of Transformations”, Journal of the Royal Statistical Society B, 26, 211-252 (1964).
Examples
>>> from scipy import stats
>>> import matplotlib.pyplot as plt
We generate some random variates from a non-normal distribution and make a probability plot for it, to show it is non-normal in the tails:
>>> fig = plt.figure()
>>> ax1 = fig.add_subplot(211)
>>> x = stats.loggamma.rvs(5, size=500) + 5
>>> stats.probplot(x, dist=stats.norm, plot=ax1)
>>> ax1.set_xlabel('')
>>> ax1.set_title('Probplot against normal distribution')
We now use boxcox to transform the data so it’s closest to normal:
>>> ax2 = fig.add_subplot(212)
>>> xt, _ = stats.boxcox(x)
>>> stats.probplot(xt, dist=stats.norm, plot=ax2)
>>> ax2.set_title('Probplot after Box-Cox transformation')
>>> plt.show()