 |
| Home | Problem Reports | Operations Schedule | Weather | Data Archive |
|
|
Prepared by: Richard Schuler,
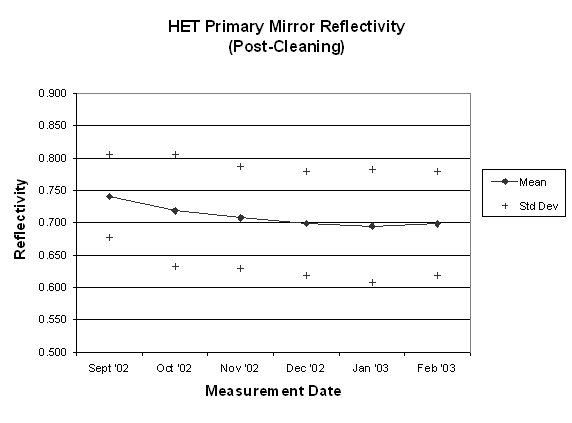
Kevin Meyer (Starting Feb '03) September 26, 2002 Version 2: October 22, 2002 Version 3: November 22, 2002 Version 4: December 19, 2002 Version 5: January 21, 2003 Version 6: February 26, 2003 Table of Contents Introduction Procedure Results Appendix A Plots of Post Cleaning Reflectivity for Sept 02 Jan 03 Appendix B Reflectivity and Scattering Data for Oct 02 Measurements Appendix C Reflectivity and Scattering Data for Nov 02 Measurements Note: Pre-cleaning measurements of SAC suspended Appendix D Reflectivity and Scattering Data for Dec 02 Measurements Appendix E Reflectivity and Scattering Data for Jan 03 Measurements Note: SAC and 23 mirror segment snow cleaned. Remaining 66 segments were blown off with CO2 gas only.Two segments were covered. Appendix F Reflectivity and Scattering Data for Feb 03 Measurements 1. Introduction In an attempt to quantify the reflective efficiency of the HET and the effects of CO2 snow cleaning, pre and post cleaning reflectivity and scattering data for selected primary and the SAC mirrors have been obtained. In addition to reporting the findings, this document represents the baseline from which future measurements / cleanings can be compared. Data obtained from future monthly measurements / cleanings will be included as part of this document. 2. Procedure All measurements were taken with the ΅Scan Scatterometer. The unit measures specular reflection using a 670 nm light source and a detector with an angle of incidence and reflection of 25 degrees. In addition to specular reflection, the scatterometer measures scattered light with two detectors located 25 degrees on either side of the specular reflection (i.e. "reflection angle" of 0.0 and 50 degrees). The unit gives the Bidirectional Scatter Distribution Function (BSDF) for each detector, and calculates the RMS surface roughness based on the BSDF data and specular reflection. The scatterometer reflective measurements are calibrated against two reference mirrors of known reflection efficiency. One is an Edmund Scientific enhanced aluminum mirror (87.4% @ 670 nm), and the other is an FSS99 coating provided by Denton Vacuum (98.6% @ 670 nm). The absolute reflectivity of each mirror was measured in June 1999 by Optical Data Associates. The reported reflectivity is scaled by the results of the calibration. The BSDF and surface roughness values reported in this document have not been scaled. 2.1 CO2 Snow Cleaning The primary and SAC M-2, M-3 and M-5 mirrors were cleaned in accordance with the HET Primary Mirror CO2 Cleaning Procedure on September 17, 2002. SAC mirror M-4 was not cleaned at that time due to potential damage to the HRS pellicle. M-4 was subsequently cleaned on September 24, 2002 when the PFIP was removed and craned to the observatory floor. 2.1 Main Mirror Reflectivity measurements in the pre-cleaned condition were taken for segments 1, 6, 10, 14, 89 and 90. These segments were selected because the pre- and post-cleaning reflection efficiencies were measured on these mirrors in June 1999. Ten readings were taken for each mirror. The approximate locations for each measurement were: six readings around the outer perimeter, three readings in the interior area, and one reading near the center. In addition to the above segments, it was decided to measure four additional mirrors at the top of the array to see if the segment reflectivity is dependent on angle. The surface of segments 81, 84, 85, 86 are more nearly parallel to the gravity vector than the original segments, and therefore, fewer particulates were expected to settle out on the mirror surface. It was therefore postulated that the coating on these mirrors might be in better shape than the segments at the lower end of the array. 2.2 SAC Ten reflectivity measurements in the pre-cleaned condition were taken for M-2, M-3 and M-4. Only 30% of M-4 was accessible, and M-5 was not measured because access to the surface was blocked by the moving baffle. M-2, M-3 and M-5 were cleaned (M-4 was not cleaned to avoid pellicle damage), after which M-2 and M-3 were measured again. Once the PFIP was on the floor, the slide was repositioned, the pellicle cover was installed, and M-4 was cleaned and measured (ten readings) over the entire surface. M-3 and M-5 still had some dust on the surface, so they were re-cleaned, and M-3 was re-measured. The moving baffle was repositioned and ten post-cleaning reflectivity measurements were taken on M-5 (no pre-cleaning measurements were available for M-5). Top of Page 3. Results 3.1 Primary Mirror The post cleaning reflection efficiencies for the main array are included in Table 1. The data published by François Piché in June 99 was amended to include all the data in the reported statistics. François omitted low reflectivity data in his statistical analysis that was between 1.6s and 3.2s from the mean. François low reflectivity values were included in the statistics so the June 99 data was consistent with the Sept 02 data statistics. Including the low measured reflectivity data points was considered accurate due to the degraded condition of the segment coatings. Based on the June 99 and Sept 02 data, the average loss of reflectivity is 5.6% / year. The post-cleaning reflectivities for segments at the upper end of the array are listed in Table 2. The measured reflectivity for these segments is not significantly different from those at the bottom of the array. Thus there appears to be no correlation between mirror angle (relative to the gravity vector) and reflectivity for the HET primary. In addition, since the post cleaning reflectivities for all measured segments lie between 69.6% and 78.3%, and this difference is spanned by the standard deviation of the measurements, it was decided that the overall pre and post cleaning statistics will be based on the composite of the 100 data points obtained from the ten measured mirror segments.
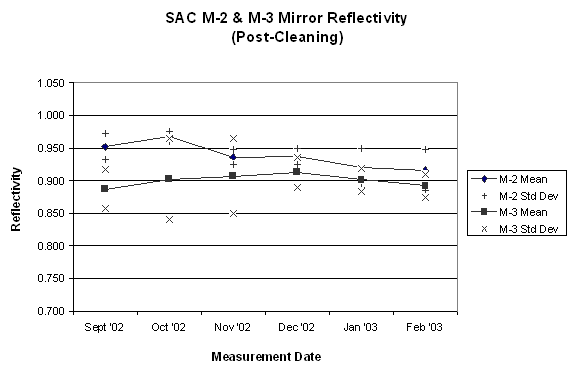
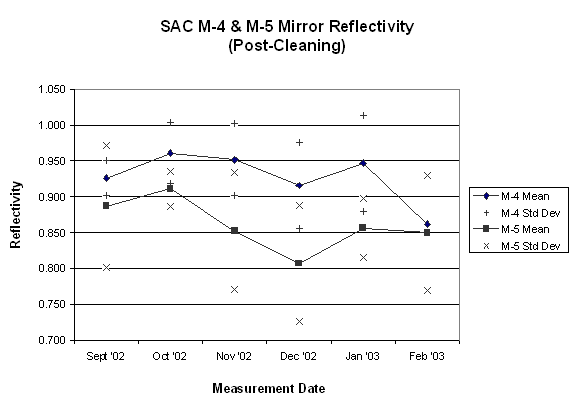
The pre and post reflection data for the primary mirror are included in Table 3. The CO2 cleaning increased the average reflectivity from 68.2% to 74.1%, or 5.9%. The average measured surface roughness and BSDF values also decreased by between 7.5% and 15.6%. In all cases the reduction of the average values is less than the standard deviation of the data. 3.2 SAC Prior to cleaning the SAC optics, it was noticed that M-5 had a significantly heavier accumulation of dust than M-3 (both M-3 and M-5 are upward facing). This observation was consistent with that of June 99. The pre and post cleaning measurements for the SAC are included in Table 4. The downward looking mirrors (M-2 and M-4) have the highest reflectivity and lowest surface roughness values. The measured change in reflectivity in the pre and post cleaned condition ranged from between -3.9 and +2.7%. The average measured surface roughness and BSDF values also decreased by between -21.8% and 60.9%. In all cases the reduction of the average values is less than the standard deviation of the data.
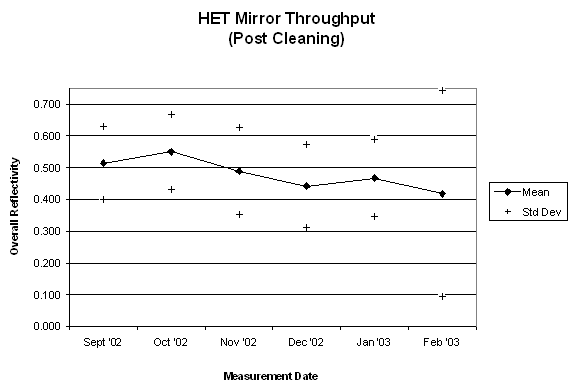
3.3 Throughput The efficiency of the entire reflective system is the product of the reflection efficiencies of all the mirrors (M-1 through M-5). Thus the overall efficiency after cleaning is: η = (0.741) (0.952) (0.887) (0.926) (0.887) η = 0.514 3.4 Scattering In order to provide a reference for the light scattered by the HET mirrors, the scattering data (surface roughness and BSDF) for the aluminum and silver standards taken on September 25, 2002 are listed in Table 5. The surface roughness that of the primary, is roughly six times that of the standards, and the BDSF values are roughly 40 (BDSF 0 deg) and 75 (BSDF 50 deg) times that of the standards. The surface roughness for the SAC mirrors range from the same value to roughly four times the standards, and the BSDF values are from roughly two to thirty times that of the standards. The surface roughness and BDSF values for the downward facing mirrors (M-2 and M-4) were significantly lower than the upward facing mirrors (M-2 and M-4).
Top of Page APPENDIX A 


Top of Page APPENDIX B: Reflectivity and Scattering Data for Oct 02 Measurements
Top of Page APPENDIX C: Reflectivity and Scattering Data for Nov ’02 Measurements
Note: The μ-scan scatterometer measures specular reflection and scattering via contact with the mirror. Since the footprints of the scatterometer are visible on the SAC mirrors, it was decided to discontinue pre-cleaning reflection measurements. APPENDIX D: Reflectivity and Scattering Data for Dec ’02 Measurements
Top of Page APPENDIX E: Reflectivity and Scattering Data for Jan 03 Measurements
Note: Six of the eight CO2 bottles on hand did not produce snow. The SAC and 23 mirror segments were snow cleaned, including all segments used in this study (1, 6, 10, 14, 81, 84, 85, 86, 89, 90). The remaining 66 segments were cleaned with CO2 gas only (segments 19 and 83 were covered). s a result, the reflection efficiencies reported may not be indicative of the entire mirror. APPENDIX F: Reflectivity and Scattering Data for Feb 03 Measurements
Top of Page Return to Technical Reports List |
||||||||||||||||||||||||||||||||||||||||||||||||||||||||||||||||||||||||||||||||||||||||||||||||||||||||||||||||||||||||||||||||||||||||||||||||||||||||||||||||||||||||||||||||||||||||||||||||||||||||||||||||||||||||||||||||||||||||||||||||||||||||||||||||||||||||||||||||||||||||||||||||||||||||||||||||||||||||||||||||||||||||||||||||||||||||||||||||||||||||||||||||||||||||||||||||||||||||
Created: see
report date above Send comments to: webmaster@het.as.utexas.edu |