|
|
| Home | Problem Reports | Operations Schedule | Weather | Data Archive |
|
|
Marsha J. Wolf Graduate Student, University of Texas at Austin October 1999 Table of Contents Introduction Testing Progress Summary Description of the Instrument Previous CCAS Results and Test Plan for the Summer Testing Results Conclusions and Recommendations to Date Acknowledgments References Earlier this year, the approaching award of a contract for the design and installation of a Segment Alignment Maintenance System (SAMS) for the HET resurfaced the need for a precise method of aligning the primary mirror segments. Specifically for the case of a SAMS, a method is required to initially align the mirror segments into a figure that meets specifications, since SAMS only maintains this figure, and also to measure the performance of the SAMS over time. This requires a quantitative measure of how the mirror segments move relative to each other, primarily in tip and tilt. The SAMS specification for maintenance of the mirror segment alignment is 0.06 arcsec for tip/tilt, which is a number that comes from the HET optical error budget. Although recent modifications to mirror stacking (or alignment) routines have improved the stacking times, resultant stack quality seems to have reached the limit of the centroiding technique. Typical stack sizes are approximately 1 arcsec for an EE50 diameter, which is not close enough to the 0.6 arcsec specification to work for the SAMS initial mirror alignment. To improve this stacking problem, the HET has a center of curvature alignment sensor (CCAS), which was designed to fine tune the primary mirror alignment. The CCAS had been tested somewhat, but not used and evaluated extensively. The initial tests resulted in marginal performance that did not lead to a clear decision path on whether the instrument was useable for its intended task. For these reasons, a CCAS test and evaluation plan was carried out over the summer and is continuing
through the present. The study was geared to answer three main questions. A summary of CCAS testing and analysis is given here. More details can be found throughout the remainder of the report. The CCAS interferometer hardware works. High contrast fringes are visible on the mirror segment images (if seeing conditions are favorable) and they logically follow mirror moves in tip and tilt. The CCAS can be used in a semi-manual mode by stacking the mirrors and then visually watching the real time image of the interferograms as mirror segments are moved in to minimize fringes. This is a mode in which the CCAS in its current state could be used for initial setup of the SAMS. In a similar manner, the CCAS can be used to identify mirror segments that are the stragglers in the stack. These segments are too far out of alignment to fit down the faceplate pinhole and show up dark in the interferogram. They are easily identified since the CCAS interferogram is an image of the mirror array. Tests have shown that these mirrors can be manually brought in by making small moves on the mirrors until they show up in the interferogram. The optical layout of the instrument was studied and documented in more detail than previously existed in any reports or briefings. We now understand how the interferometer works at a much higher level than before, which is necessary for diagnosing problems. Details of the optics are given in Appendix A. The theory of operation is also described in Section 3. The CCAS software is being thoroughly tested for the first time. A number of bugs have been found and corrected, some of which may have adversely affected the performance of the instrument. Software documentation is also in progress. Since the hardware seems to perform fairly well, it is expected that any problems lie in the software. Debugging is still in process. Tests on a thermally stable night early in the summer revealed that tip and tilt were swapped in the mirror correction files that the CCAS software outputs. This partly explains why improvements in the stack were not previously observed after the application of these corrections to the mirrors. After this problem was corrected, tests show a slight improvement in tip, but not in tilt after application of corrections. This behavior is still under investigation and the cause is expected to lie in the software calculations. During the summer, electrical noise appeared in the camera images and continued to get worse. It reached a point where it began to seriously affect the measurements. Noise, manifested as light and dark bands in the images, decreased the capturability of mirrors. This problem occurred after initial tests on groups of only 7 mirrors and prevented tests of the total number of mirrors in the fully populated array that could be captured with the CCAS. This problem seems to be isolated to the frame grabber cards and is still being diagnosed. It must be repaired before further characterization of CCAS performance can be conducted. The effects of outer tower shake on CCAS performance were investigated. When inducing a small vibration in the outer tower, not much visible shake in the image of the stack on the faceplate is perceptible, but enough motion is transferred to the inner tower to cause the fringes in the interferogram to scan across the image. Although the cameras are supposed to all be triggered to take images at the same time, they output a TV video signal, which is scanned down the screen in the normal way. Since this takes a finite amount of time, it was thought that minimizing any movement of fringes would have to help. Fringe movement during an image capture has the effect of graying out the fringes and reducing the instruments ability to make a measurement. Guy wires are being added to the outer tower for stability. A maximum of about 10 fringes are visible on each mirror segment in the interferogram. Since the cameras on the CCAS cut the resolution of the CCD array images in half to convert them to TV video output, the cameras can resolve only a maximum of 5-6 fringes. Each fringe corresponds to approximately 0.6 arcsec of misalignment in mirror segments, so 6 fringes gives a capture range of 0.36 arcsec. If the cameras could resolve 10 fringes, the capture range would increase to 0.6 arcsec. This could be achieved with higher resolution digital output CCD cameras. However, it would be desirable to increase the capture range even further, ideally to 1-2 arcsec, which would match the current stacking ability. This might be possible by scaling up the image size and obtaining cameras with larger arrays and smaller pixels. Methods of doing this will be investigated. It would require a change of optics, higher resolution digital cameras, software modification in communicating with the cameras, and possibly an upgraded computer for handling images from larger arrays. Action items for progressing further are given below.
Top of Page 3. Description of the Instrument A description of the instrument and its operation is given here to aid in understanding the tests
and results that will be described later. For more details on the optical layout and the software flow,
see Appendices A and B.
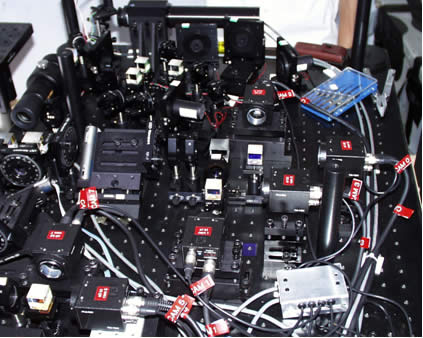
3.1. Theory of Operation in Tip/Tilt Mode The CCAS is a dual-arm polarization shearing interferometer. It is shown in Figure 1 . Light from a HeNe laser is projected down to the HET primary mirror and reflected back to a focus at the faceplate of the CCAS, which is at the center of curvature of the primary. The reflected, focused light goes through a pinhole in the center of the faceplate and enters the interferometer. It is then collimated, at which point it is a parallel beam image of the primary mirror array, and split into two arms. The beams in each of these arms go through a pair of Wollaston prisms, which do the image shearing. The orientation of the polarization of the light entering the Wollaston prism is such that the prism angularly separates the image into two that have polarizations 90o out of phase. (e.g. It sends the linear polarization at 45o off at one angle, and that at - 45o off at the opposite angle.) The second Wollaston prism in the pair is reversed with respect to the first and it undoes the angular deviation of the beams, sending them out parallel and separated by a distance that overlaps one mirror segment on top of its neighbor. Because this is coherent laser light, an interference pattern is created in the overlapped image. If the two segments were perfectly aligned, you would see only 1 fringe (half light, half dark) on the segment. As tips and tilts are introduced between the two mirror segments, horizontal and vertical fringes appear. The second arm of the instrument does exactly the same thing, except that the shearing direction is 120o from the first. These directions are illustrated in Figure 2. The tip/tilt part of the code begins by checking to make sure that there are intensity variations, or
fringes, on the mirror segment image and then calculates a phase difference, or piston, between mirror
segments for each pixel on the image. Once this is done across the whole mirror segment, a plane is fit
to the pixel piston values using a least squares method. This results in a plane that represents how one
segment is slanted compared to the other. Tips (rotations about x) and tilts (rotations about y) are
calculated from the slope of the fitted plane. These tips and tilts are then sent to a mirror correction
file that can be applied to the mirror segments for fine tuning their alignment.
The point-by-point piston for each pixel is calculated from pixel intensities on the 4 cameras in each arm. In getting to these 4 cameras, the sheared image of the mirror array is split into 4 images with beam splitters. Via polarizing beamsplitters and waveplates, phase shifts in 90o increments are introduced into the polarization of each of these 4 images. We end up with one image where no extra phase has been introduced, so it is at 0o. The other three have phase shifts of 90o, 180o, and 270o relative to the 0o image. The introduction of these phase shifts into the images has the effect of moving the interference fringes over by amounts corresponding to the introduced phase shifts. If the intensities on all 4 cameras are represented by I0, I90, I180, I270, the phase difference between segments at that point,
where x,y represents the position of the pixel on the image of the mirror segment. An example of fringes from the 4 cameras in Arm 0 is shown in Figure 3. As 90o phase shifts are introduced into the images, the fringes should shift by half a fringe for 90o, a whole fringe for 180o (dark becomes light), and 3/4 of a fringe for 270o. Figure 4 illustrates this in a schematic. Figure 3 can be related to Figure 4 by starting at the lower left image in Figure 3 and working counter clockwise. The lower left image is 0o, the lower right is 90o, the upper right is 180o and the upper left is 270o. These same 4 intensities can be inserted into an equation to calculate an
intensity contrast value
between cameras at that pixel,1,4
After a check of the pixel intensity against a minimum brightness value in the program, the contrast value for the pixel is checked against a minimum one set elsewhere in the code. As the fringes are shifted relative to the other 3 camera images, varying intensities should be seen at the same pixel in each camera. However, if all 4 intensities are too similar in value, a low contrast value will be calculated. This could be indicative of a problem such as a mirror with its fringes washed out by seeing or noise effects, a mirror that is dark because has moved far enough out of the stack to be obscured by the edge of the faceplate pinhole, or a mirror with too many fringes for the number of pixels in the CCD cameras to distinguish between light and dark areas. In any of these cases, a good tip/tilt measurement cannot be made. If a mirror segment has at least 50% of its pixels below the minimum contrast value, it is thrown out and shows up with a blue line between it and the previous segment on the CCAS computer screen, along with a fringe warning. That mirror is not captured.
One mirror segment is selected to be the reference segment and all others are referenced back to it
via specific mirror paths. If the path to a mirror from the reference is not possible through mirrors
with good measurements, that mirror cannot be measured. Fringe warnings are given to such mirrors and
no tips or tilts are calculated. For any mirror segments that cannot be measured, their correction
values saved to the file are set to zero. The correction file is structured such that it can be
directly sent to the primary mirror computer (PMC), which takes the values in arcseconds and converts
them to mirror actuator moves that are sent to the segment positioning system (SPS) to make the corrective
moves. 4. Previous CCAS Results and Test Plan for the Summer A test series to quantify the CCAS performance was conducted by François Piché
last year.5,6,7 At that time 66 mirrors were in place in the array.
The capture percentage for mirrors in tip/tilt mode was found to be approximately
65%,
with the inner ring mirrors having higher percentages (68%) than outer ring
mirrors (59%). The measurement reproducibility was an average of 0.09 for
tip and 0.08 for tilt. Application of the mirror corrections calculated by
the CCAS showed no distinguishable improvement in the mirror stack either by
taking a second CCAS interferogram measurement, or by measuring the EE50 stack
size. Figure 5 shows a plot of applied corrections from these tests. The x-axis
is the measured tip/tilt errors before corrections were applied and the y-axis
is the difference in measured errors before and after applying corrections.
If improvements were made, the data points should begin to orient along a line
with a slope of +1, indicating that the residuals were approaching zero. No
real improvement is evident. Tests were also performed on the piston measurement
mode of the CCAS, but they will not be addressed in this report.
Tests this summer concentrated on the tip/tilt measurement mode of the CCAS, since this aspect of mirror alignment is the most important on short time scales. Piché monitored piston motions of mirror segments over a period of a few months and found that they do not change much. Tip/tilt mirror movements dominate the unstacking of the array due to thermal gradients during telescope operation. The CCAS tests began with 7 mirror segments near the center of the array. This configuration gave a small sample of mirrors that should be some of the most well-behaved in the array since they are moved the smallest distances during stacking, and also matched the number of segments that will be used for a demonstrator early in the SAMS project. Special stacking codes were written by Grant Hill to stack only 7 mirrors on the right or left side, using the center mirror (# 43) as the stationary reference. These mirror configurations are shown in Figure 6. The 6 segments around the center mirror could not be used because the tracker in its furthest negative x position still obscured parts of the segments to the left of center, and likewise on the right side. The stacking codes used a small ring burst pattern (2 or 3 arcsec radius) so that hysteresis corrections were unnecessary. Only stacking these 7 mirrors also saved a lot of time in doing multiple stacks per night for collecting CCAS data. The data collected on these 7 mirrors were used to quantify capture percentages and measurement repeatability on a small set of mirrors that should have typically been stacked to within the capture range of the instrument. After instrument performance was characterized on the small set of mirrors, more segments were included in the tests to get a measure of capturability for the whole array. The CCAS had never before been used on the fully populated array. The CCAS software had never been thoroughly debugged, so an effort was also made to do this.
Problems were found and corrected along the way.
Top of Page 5.1. The Interferometer Hardware Performance The CCAS interferometer seems to work rather well. This comes as a bit of a surprise, given the 52 meters of path length through the atmosphere between the instrument and the HET primary mirror. Although the instrument is common path, the primary mirror is 11 meters across and air flow throughout the dome is not yet uniform, making it not really common path. Seeing effects are very apparent when watching the real time video of the mirror array interferograms. However, the fringes are quite clear at times and behave exactly as expected with small mirror moves. Tips of mirrors create straight horizontal fringes and tilts create straight vertical fringes. Segment alignment can be improved by visually watching fringes and minimizing them by making mirror moves. This will be discussed further as the CCAS in semi-manual mode in Section 5.6. One concern with the interferometer has been the stability of its construction. The optics are mounted on an optical breadboard in small Newport mounts that are not overly sturdy. The concern was that they might allow the optics to move, resulting in measurement repeatability problems. However, this does not seem to be the case. The interferometer operation is fairly robust. Things like tower sway in the wind and HET dome seeing are more detrimental to the instruments performance. It does not seem that the cost of replacing all of the optic mounts would be worth it at this point. 5.2. The Software Performance Many bugs in the software have been found and corrected. The code has now been thoroughly documented and the debugging continues. 5.3. Problems Encountered During Testing 5.3.1. Tip and Tilt Swapped in Software During early tests on 7 mirrors, a very thermally stable night allowed us
to determine that the CCAS software had tip and tilt swapped. The temperature
stayed within 0.1o F for 3-4 hours. Normally,
mirror truss movements in temperature gradients of 1oF per hour are enough to
add too much noise to the CCAS repeatability to see the direction of small
mirror moves. This error could not have been found under
less pristine conditions. The 7 mirrors were stacked, measurements were made,
specific mirrors were moved by 0.1-0.2 arcsec in tip and tilt, measurements
were repeated. It was found that tip moves were measured
as tilt, and tilt moves were measured as tip. The data are shown in Figure
7.
There is some ambiguity to the correct sign for tilt, as can be seen in the
plot. The software was modified to write the
corrections to the file in reverse order. Weather conditions have not been favorable
to verify that
the movements are now correct.
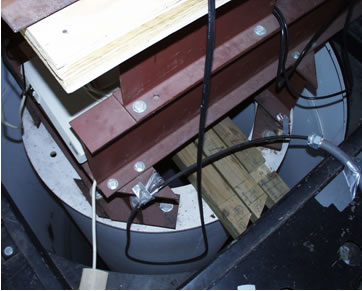
It should be noted that the only place where this change was made in the software was where the correction file is written. The tip/tilt error vectors that appear on the screen are still swapped, which can cause some confusion if analyzing them from the screen. This will be changed in the software. 5.3.2. Frame Grabber Card Failure One of the frame grabber cards for the 8 cameras failed during the test series. A new one was ordered from the manufacturer. When it was installed, it did not sync properly. Some of the images from this card were offset relative to the others. It also had intermittent black lines through the image. Both conditions adversely affect the tip/tilt measurement. In working with the manufacturer, it was found that our old cards had a previous version of the EEPROM microcode. Once the old one was reloaded, the card worked fine. 5.3.3. Electrical Noise in Camera Images Noise in the camera images began to show up and continued to get worse over the summer. Some of this noise can been seen in Figure 3 as horizontal and vertical bands. The source of the noise seems to be coming from the frame grabber cards. Other components have been eliminated and when the frame grabbers are bypassed, the noise goes away. By August, this problem became bad enough that it reduced mirror capture percentages and made measurements unreliable toward the end of the summer. It is still being diagnosed. At about the same time that this noise problem appeared, a noticeable difference in the images on the two arms appeared. The fringes on Arm 1 look worse than on Arm 0 much of the time. Arm 1 is closer to the HeNe laser in the instrument and since the laser generates heat, ventilation was attempted, but with no visible change in fringes. This problem may be related to the image noise, but this is not yet known. 5.3.4. Optical Noise in Camera Images There are some laser reflections that appear in all 8 camera images. These reflections come from a microscope objective in the laser projector that sends the HeNe beam down to the primary mirror. They can be seen in Figure 3. There are 2 small bright circles on the right side and two large dim circles on the left side. These seem to be coming from the lens surfaces themselves. Placing apertures in front of the objective or at a pupil have no effect on the reflections. Ways of reducing them are being investigated. They do have an effect on the measurements in some cases. If the reflections cannot be eliminated, a software solution of subtracting them out may be sought. 5.3.5. False Mirror Captures If the CCAS tower window shutter is left closed, so that the HeNe beam does travel down to the HET primary mirror and back, and CCAS measurements are made on just the noise in the images, mirrors are captured. It is not a high percentage, but is as high as some tests late in the summer with the primary mirror in the loop. This says that the noise sources in the images may be causing serious problems. 5.3.6. Seeing Issues It was noticed during a night with little wind that seeing effects in the interferograms were
very sensitive to the wind speed. At < 8 mph the fringes were getting completely
washed out and huge waves could be seen passing through the mirror array interferogram
image. However, at > 10 mph
the fringes looked much more stable. Such a large change in seeing conditions for only a 2 mph change
in wind speed lead us to believe that the seeing problem might be in the CCAS tower itself, rather
than in the large HET dome area. A fan was installed in the tower room to draw air through it, but
this did not affect the seeing. The instrument cover was removed to allow more air flow around the
interferometer and this also had no effect. There could still be some seeing issues in the tower,
but it seems that most of it must be in the HET dome. One concern is that hot air could come up
from in between the inner and outer towers. The tower configuration is shown in Figure
8 . There
is a plan to install larger and more down draft fans in the HET dome. These should help CCAS seeing
issues. If not, then ventilation in the CCAS tower may be required.
5.3.7. Software Bugs Affecting Performance Two bugs have been found that could affect the CCAS calculations. The first was that the value of π was defined wrong. A digit was dropped in the 5th place after the decimal point. The second problem was that the gains and offsets for the 8 cameras were read from their file incorrectly. Two lines of values are written for each camera during an initial setup and calibration of the instrument. This file of values is read every time the CCAS software is started. However, when the file was read by the code, it took 3 lines of data for each camera. This incorrectly assigned all the values. These gains and offsets are used to balance the cameras and optical path losses to each other. Having the wrong values affects the intensities at each camera. Since the pixel intensity values are the whole basis of the measurement, this could be a big problem. This bug has been corrected and was tested, however, the system performance did not seem to improve after the correction. It is expected that the video noise mentioned in Section 5.3.3 may be a larger effect that masks any change due to now having the correct gains and offsets for each camera. 5.3.8. Low Contrast Problem As mentioned in Section 3, one of the first steps in the program is to calculate an intensity
contrast value for each pixel, based on the 4 cameras in that arm. It was noticed that after the
electrical noise showed up, many of the segments were thrown out because of low contrast values.
An example is shown in Figure 9. To try and understand this problem, the code was modified to
output a file containing the internally calculated contrast and piston values during a measurement.
This allows a comparison of what the program thinks are high contrast areas and what the fringe
images look like. An example of contrast contour maps are shown in Figure
10. These data are from
the same measurement as the fringe images shown in Figure 3, however the order of the segments is
still being sorted out.
Pixel piston values are then calculated for all pixels that pass the minimum contrast criteria. A plane is fit to all piston values for a segment interferogram, giving the tip and tilt of the two mirror segments relative to each other. Figure 11 shows the piston values calculated for the 4 mirror segments whose contrast values are shown in Figure 10.
Soon, all of these data should be useful in evaluating how the CCAS program is interpreting the interferograms. The fitted plane, used to get tip and tilt values for the segments, will also be added to the piston value plots to aid in checking that part of the program. Top of Page 5.4. Measurement Performance Average values for the CCAS performance are given in Table 1. The data in the upper part of the table were taken before the electrical noise began affecting images, the data in the lower part were affected by this problem. Note the decreased capture percentages in the lower part of the table. Average small represents the average values for small groups of mirrors, while average half is for half the mirror array. The noise problem must be repaired before good data can be collected on large numbers of mirrors. 5.5. Application of Corrections Although weather conditions have not been favorable to measure directions of mirror moves with the CCAS since the tip and tilt swap was corrected, data from the application of CCAS corrections indicate that things are more well behaved now. Figure 12 shows a plot of measured CCAS errors before and after the application of corrections when tip and tilt were swapped. No trends toward improvement are apparent in the plot. If anything, tip seems to not have changed and tilt might have gotten worse. Likewise, Figure 13 shows the absolute value improvement in tip/tilt errors after application of CCAS corrections under the same conditions. Table 1. Summary of CCAS performance data.
Figure 14 and Figure 15 show similar plots after the tip and tilt swap was corrected. Now tip seems to show some improvement after the application of corrections, while tilt does not. The horizontal and vertical lines represent the noise level on measurement repeatability, +/- 0.06 arcsec. Not much can be said about improvement for data points lying within these regions, but even so, the tip data points lie along a somewhat horizontal line, while tilt data points lie nearly along a line with a slope of +1 showing no change. It is expected that the problem with tilt corrections will be found in the software calculations. This is still being investigated. The CCAS seems to do better in its correction calculations for larger initial errors, as seen in Figure 15. Piché saw similar behavior in his tests last year.6
5.6. The CCAS in Semi-Manual Mode The CCAS can be used in a semi-manual mode by stacking the mirrors and then visually watching the real time image of the interferograms as mirror segments are moved in to minimize fringes. This is a mode in which the CCAS in its current state could be used for initial setup of the SAMS. In a similar manner, the CCAS can be used to identify mirror segments that are the stragglers in the stack. These segments are too far out of alignment to fit down the faceplate pinhole and show up dark in the interferogram. They are easily identified since the CCAS interferogram is an image of the mirror array. Tests have shown that these mirrors can be manually brought in by making small moves on the mirrors until they show up in the interferogram. The sizes of stack images were measured after a stack, and again after manually moving
mirrors to minimize CCAS fringes. Mirror moves were made in increments of 0.1 arcsec in
tip and tilt. Fringes went from 4-5 per mirror segment to 1-2. Four rounds of these
tests gave EE50 stack improvements of 0, 0.08, 0.05, and 0.05 arcsecs. The sizes of both
the stack of 7 mirrors and of seeing mirrors were approximately 0.7 arcsec at EE50. 6. Conclusions and Recommendations to Date 6.1. For SAMS The CCAS in its current state could be used in the semi-manual mode to initially setup the mirrors for SAMS. Alignment degradation could be monitored by watching the fringes and saving images periodically. Before the electrical noise began affecting mirror capturability, a group of 7 mirrors could routinely be captured and measured for typically up to 10 minutes after the stack, depending on temperature gradients outside. If this problem is repaired and the software is debugged, the CCAS may well work in its intended operational mode by the time the seven segment demonstrator comes around. No comment can yet be made on using the CCAS for the whole mirror array. The semi-manual mode could also be used for the whole array, although this would be a slow and painful process for that many mirrors. 6.2. For the HET Long Term As mentioned above, it is too early to tell the ultimate fate of the CCAS for the whole mirror array. We have made progress and continue to do so. The belief that the CCAS may be capable of its intended job is stronger than it was at the beginning of the summer. Once the software is fully sorted out, the future usefulness of the instrument will be clearer. Once the software is working properly, other upgrades can be pursued. A maximum of about 10 fringes are visible on each mirror segment in the interferogram. Since the cameras on the CCAS cut the resolution of the CCD array images in half to convert them to TV video output, the cameras can resolve only a maximum of 5-6 fringes. Each fringe corresponds to approximately 0.6 arcsec of misalignment in mirror segments, so 6 fringes gives a capture range of 0.36 arcsec. If the cameras could resolve 10 fringes, the capture range would increase to 0.6 arcsec. This could be achieved with higher resolution digital output CCD cameras. However, it would be desirable to increase the capture range even further, ideally to 1-2 arcsec, which would match the current stacking ability. This might be possible by scaling up the image size and obtaining cameras with larger arrays and smaller pixels. Methods of doing this will be investigated. It would require a change of optics, higher resolution digital cameras, software modification in communicating with the cameras, and possibly an upgraded computer for handling images from larger arrays. 6.3. Recommendations Action items for progressing further are given below.
Other miscellaneous items include the following.
I would like to thank the following people for their help in this project. Mike Ward, systems analyst at McDonald Observatory, did an excellent job of debugging and documenting the CCAS code. Brian Roman and Ben Rhoads, telescope operators at the HET, spent many nights doing multiple mirror stacks and making CCAS measurements. Craig Nance, facility manager and electrical engineer at the HET, spent lots of his nonexistent time tracking down electrical noise problems in the CCAS hardware. Grant Hill, HET resident astronomer, wrote special mirror stacking codes that made these tests possible. John Booth, HET project engineer, gave valuable suggestions for and assistance in testing throughout the summer. He also led the project of guying the CCAS tower for stabilization. Jim Fowler, HET systems analyst, assisted in debugging and making corrections to the CCAS code. François Piché, HET optical engineer, provided much insight from his previous work on the CCAS. Dan Jaffe, faculty at UT Austin, was a big help in reviewing my interpretation of the physics in the CCAS measurements and in providing ideas for alternate methods of interpreting the interferograms.
1Gressler, William, HET Technical Report #78, HET Center of Curvature Alignment Sensor
(CCAS) Reference Document, 23 February 1995. |
Created: see
report date above Send comments to: webmaster@het.as.utexas.edu |
 .
.