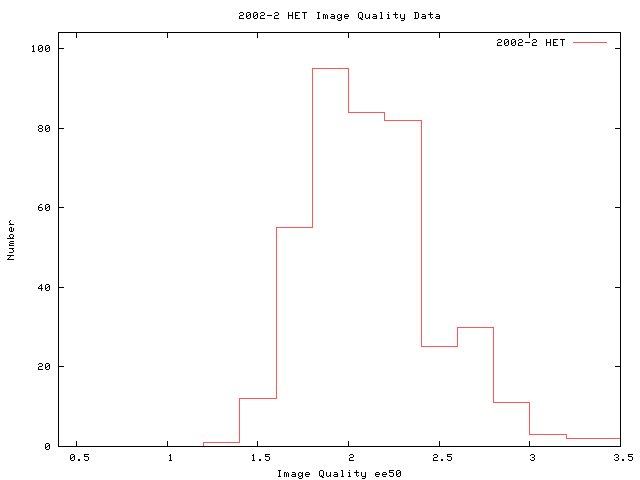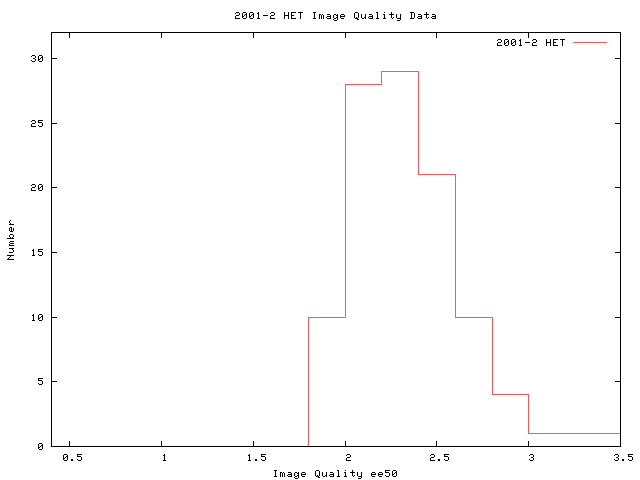
In this section we will discuss the status of each instrument and any limitation to configurations that occurred during the period.
The image quality of the HET has improved a bit over last year.

For comparison here is the image quality for the same period of 2001

Month by Month Summary
| Month | A:Fraction of the Time that was Possible Science | B:Average Night Length | C:Fraction of Time Lost due to Weather | D:Fraction of Science Time Lost due to Alignment | E:Fraction of Science Time Lost due to Calibrations | F:Fraction of Science Time Lost due to Problems |
|---|---|---|---|---|---|---|
| April | 0.775 | 8:16 | 0.52 | 0.29 | 0.03 | 0.11 |
| May | 0.777 | 7:14 | 0.32 | 0.22 | 0.02 | 0.14 |
| June | 0.952 | 6:39 | 0.36 | 0.21 | 0.03 | 0.02 |
| July | 0.83 | 6:56 | 0.49 | 0.11 | 0.02 | 0.06 |
July numbers for the above table not available at time of report.
The total number of acceptable shutter open hours during this period is 140 hours. This number is based upon our queue data base. There were a number of rejected spectra obtained during this period as well the following table give the total number of rejected spectra and the category that each falls into.
| Number of Times | Time Lost (Hours) | Type |
|---|---|---|
| 5 | 3.7 | E - Rejected by RA for Equipment Failure |
| 4 | 0.9 | H - Rejected by RA for Human failure |
| 17 | 6.4 | W - Rejected by RA for Weather |
| 1 | 0.3 | P - Rejected by PI and confirmed by RA |
| 0 | 0.0 | C - Acceptable by RA but PI rejects |
| 2 | 0.3 | N - Acceptable but NOT charged due to weather or hole in queue |
| 16 | 5.4 | B - Acceptable but Border line conditions |
So this is a total of 11.6 hours of rejected spectra with an additional possible 5.4 hours of spectra that may be rejected.
The following links give the summary for each institution and its programs.
The resulting table will give (for each program) the total number of targets
in the queue and the number completed, and will give the CCD shutter open
hours, 10 minute overhead per visit, and the TAC allocated time.
This usually will be the best
metric for judging completeness but there are times when a PI will tell
us that a target is "done" before the total number of visits is complete.
The following is a summary of the Acceptable CCD shutter time for each
institution based on our htopx data base. It does not include any
overhead.
Observing Programs Status
Program comments:
UT02-2-002: (Hooper) No Phase II ever received.
UT02-2-006: (Shields) TOO program with all submitted targets completed
UT02-2-007: (Tufts) This program was not completed due to very poor weather in the first month of the period.
UT02-2-010: (Mukremin) This program is complete
Program comments:
PSU02-2-024: (Brandt) TOO program with all observable targets completed.
PSU02-2-025: (Ramsey) No phase II ever received.
PSU02-2-043: (Ciardullo) This program can not be executed due to filter constraints.
Program comments:
STA02-2-002: (Thompson) This program was never done due to track-interference with UT02-2-007 (a UT priority 0 target).
Program comments:
Program comments:
All programs complete
Institution Status
| Time Usage by Institution (hours) | ||||
|---|---|---|---|---|
| -TOTAL- | Used | % of All | ||
| PSU | 39.351 | 29.4 | ||
| UT | 75.429 | 56.3 | ||
| Stanford | 10.375 | 7.7 | ||
| Munich | 3.757 | 2.8 | ||
| Goetting | 5.000 | 3.7 | ||
| NOAO | 6.583 | -- | ||
| SALT | 0.000 | -- | ||
| DDT | 0.000 | -- | ||
This is how each institution has allocated its time by priority.
| Time Allocation by Institution (hours) | |||||
|---|---|---|---|---|---|
| Institution | Priority 0 | Priority 1 | Priority 2 | Priority 3 | Priority 4 |
| PSU | 1.670 (1%) | 42.930 (26%) | 42.000 (25%) | 30.600 (18%) | 49.000 (29%) |
| UT | 24.000 (9%) | 103.400 (41%) | 70.800 (28%) | 54.500 (22%) | 0.000 |
| Stanford | 0.000 | 21.750 (100%) | 0.000 | 0.000 | 0.000 |
| Munich | 0.000 | 0.000 | 0.000 | 0.000 | 0.000 |
| Goetting | 0.000 | 0.000 | 0.000 | 0.000 | 0.000 |
| NOAO | 0.000 | 53.700 (73%) | 20.000 (27%) | 0.000 | 0.000 |
| SALT | 0.000 | 0.000 | 0.000 | 0.000 | 0.000 |
| DDT | 0.000 | 0.000 | 0.000 | 0.000 | 0.000 |
| UT02-2 | ||
|---|---|---|
| Program | Priority | Comments |
| None | ||
| PSU02-2 | ||
|---|---|---|
| Program | Priority | Comments |
| PSU02-2-032 | 2 | 1 2700s visit with HRS in dark time |
| STA02-2 | ||
|---|---|---|
| Program | Priority | Comments |
| None | ||
| MUN02-2 | ||
|---|---|---|
| Program | Priority | Comments |
| None | ||
| G02-2 | ||
|---|---|---|
| Program | Priority | Comments |
| None | ||