In this section we will discuss the status of each instrument and any limitation to configurations that occurred during the period.
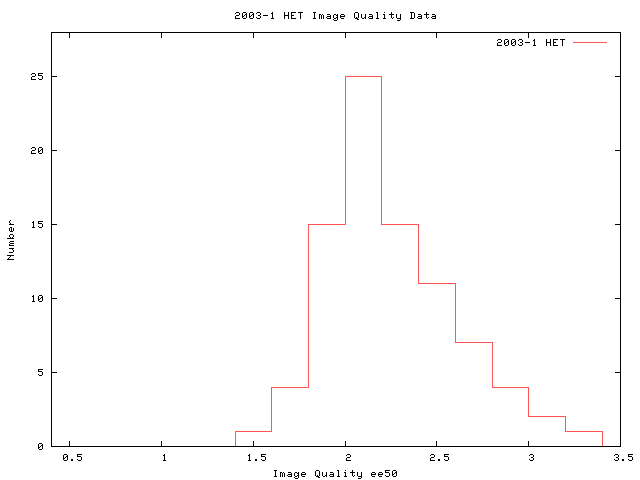
The following image quality statistics were taken from the statistics recorded for science operations in the night report.
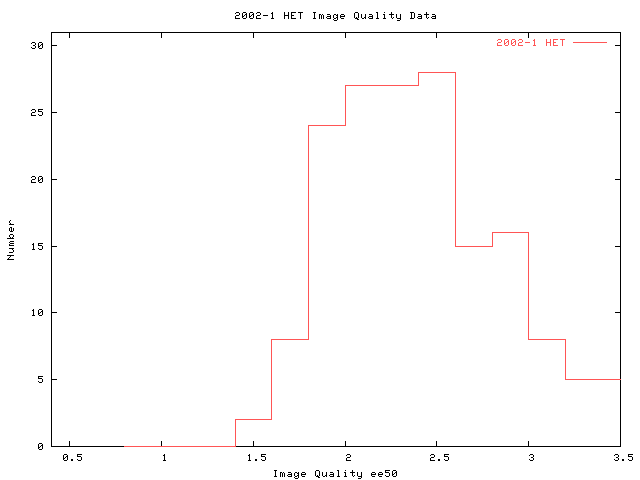
For comparison here is the image quality for the same period of 2002
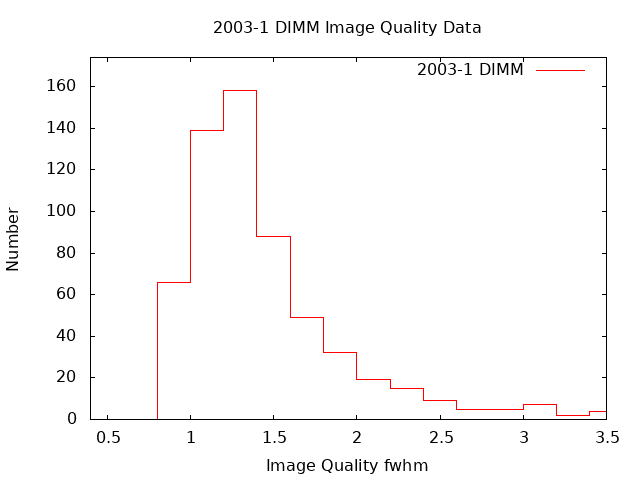
Here are the DIMM values reported in the night report. NOTE: There are a large number of nights when the DIMM was not operated; there is also times when the DIMM failed due to wind shake or extremely bad seeing.
Month by Month Summary
The following table gives the observing statistics for each month. The second column gives the fraction of the month that was spent attempting science (as opposed to engineering or instrument commissioning). Science time is defined to begin at 18 degree twilight or the first science target. Science time is defined to end at 18 degree twilight or the last science target. The fourth column gives the fraction of the possible science time (A) lost due to weather. The fifth through seventh columns give the amount of remaining science time (after removing weather losses) not spent attempting science targets. Please note that the first stack of the night often occurs before 18 degree twilight.
| Month | A:Fraction of the Time that was Possible Science | B:Average Night Length | C:Fraction of Total Science Time Lost due to Weather | D:Fraction of Actual Science Time Lost due to Alignment | E:Fraction of Actual Science Time Lost due to Calibrations | F:Fraction of Actual Science Time Lost due to Problems |
|---|---|---|---|---|---|---|
| December | 0.590 | 10.94 | 0.43 | 0.06 | 0.06 | 0.06 |
Details on Nightly cloud cover based on the TO's observations of the sky reported 3 times a night in the night report.:
| Month | Fraction of the Nights that were Clear | Fraction of the Nights that were Mostly Clear | Fraction of the Nights that were Partly Cloudy | Fraction of the Nights that were Mostly Cloudy | Fraction of the Nights that were Cloudy |
|---|---|---|---|---|---|
| December | 0.23 | 0.19 | 0.26 | 0.10 | 0.19 |
Please note that the HET could be closed due to humidity, smoke or high dust count and still have a "Clear" statistic in the night report.
The total number of 506 acceptable shutter open science exposures during this period for a total of 65.3 hours. There were a number of rejected spectra obtained during this period as well the following table give the total number of rejected spectra and the category that each falls into.
| Number of Times | Time Lost (Hours) | Type |
|---|---|---|
| 5 | 0.8 | E - Rejected by RA for Equipment Failure |
| 5 | 0.2 | H - Rejected by RA for Human failure |
| 27 | 3.9 | W - Rejected by RA for Weather |
| 0 | 0.0 | P - Rejected by PI and confirmed by RA |
| 1 | 0.2 | Q - Rejected due to error in the queue |
| 1 | 0.2 | C - Acceptable by RA but PI rejects |
| 5 | 1.4 | N - Acceptable but NOT charged due to weather or hole in queue |
| 36 | 5.7 | B - Acceptable but Border line conditions |
So this is a total of 6.7 hours of rejected spectra with an additional possible 5.7 hours of spectra that may be rejected.
The following overhead statistics include slew, setup, readout and refocus between exposures (if there are multiple exposures per visit). In the summary page for each program the average setup time is calculated. The table below gives the average setup time for each instrument PER VISIT and the average and maximum science exposures (ie. the CRSPLIT NOT the VISIT length).
| Instrument | Avg Overhead (min) | Median Overhead (min) | Avg Exposure (sec) | Median Exposure (sec) | Max Exposure (sec) |
|---|---|---|---|---|---|
| LRS | 15.4 | 14.8 | 759.0 | 600 | 1500 |
| HRS | 10.7 | 9.3 | 944.4 | 900 | 1800 |
The following links give the summary for each institution and its programs.
The resulting table will give (for each program) the total number of targets
in the queue and the number completed, the CCD shutter open
hours, average overhead for that program, and the TAC allocated time.
This usually will be the best
metric for judging completeness but there are times when a PI will tell
us that a target is "done" before the total number of visits is complete.
The following is a summary of the Acceptable CCD shutter time for each
institution based on our htopx data base. It does not include any
overhead.
Observing Programs Status
Program comments:
UT02-3-003: (Shields) Carried over from last period.
UT02-3-012: (Endl) Carried over from last period.
UT03-1-002: (Shetrone) ON HOLD; HRS Synoptic program possibly complete.
UT03-1-003: (Barnes) HRS Synoptic; no more priority 0 targets
UT03-1-008: (Gebhardt) LRS G3 and G2 targets
UT03-1-009: (Hill) Almost all of the targets conflict with UT03-1-010 and other galactic pole projects
UT03-1-011: (Kannappan) LRS G3 targets
UT03-1-012: (Endl) Phase II not received.
Program comments:
PSU02-3-050: (Ge) Carried over from last period.
PSU02-3-052: (Richards) Carried over from last period.
PSU03-1-002: (Schneider) Phase II not received.
PSU03-1-003: (Brandt) G2 Synoptic on schedule.
PSU03-1-004: (Schneider) Phase II not received.
PSU03-1-008: (Ciardullo) Phase II not received.
PSU03-1-009: (Richards) Program complete
PSU03-1-011: (Eracleous) G3 targets
PSU03-1-013: (Palma) G3 MOS with 1.8" IQ constraint
PSU03-1-014: (Eracleous) All submitted targets completed
PSU03-1-015: (Ramsey) Phase II not received.
Program comments:
STA03-1-002: (Romani) G2 target.
Program comments:
MUN02-3-001: (Botzler) carried over from last period, 2 MOS targets into evening twilight
Program comments:
There are no new programs in this period.
G02-3-001: (Kollatschny) Synoptic target carried over from last period
G02-3-004: (Hessman) Synoptic target carried over from last period
Institution Status
| Time Usage by Institution (hours) | ||||
|---|---|---|---|---|
| -TOTAL- | Used | % of All | ||
| PSU | 22.769 | 29.7 | ||
| UT | 42.239 | 55.0 | ||
| Stanford | 7.167 | 9.3 | ||
| Munich | 2.069 | 2.7 | ||
| Goetting | 2.500 | 3.3 | ||
| NOAO | 8.492 | -- | ||
| SALT | 0.000 | -- | ||
| DDT | 0.000 | -- | ||
This is how each institution has allocated its time by priority.
| Time Allocation by Institution (hours) | |||||
|---|---|---|---|---|---|
| Institution | Priority 0 | Priority 1 | Priority 2 | Priority 3 | Priority 4 |
| PSU | 11.500 (10%) | 25.200 (23%) | 37.700 (34%) | 36.500 (33%) | 0.000 |
| UT | 13.500 (6%) | 49.900 (20%) | 61.400 (25%) | 59.600 (24%) | 60.000 (25%) |
| Stanford | 0.000 | 7.000 (34%) | 6.000 (29%) | 7.500 (37%) | 0.000 |
| Munich | 0.000 | 0.000 | 0.000 | 0.000 | 0.000 |
| Goetting | 0.000 | 0.000 | 0.000 | 0.000 | 0.000 |
| NOAO | 0.000 | 53.700 (56%) | 42.600 (44%) | 0.000 | 0.000 |
| SALT | 0.000 | 0.000 | 0.000 | 0.000 | 0.000 |
| DDT | 0.000 | 0.000 | 0.000 | 0.000 | 0.000 |
| UT03-1 | ||
|---|---|---|
| Rank | Program | Constraints |
| 1 | UT03-1-003 V2203_D31F | HRS, synoptic visit, Vsky > 19.2 ,EE50 < 2.0 |
| 2 | UT03-1-010 | LRS MOS targets, Vsky > 20.8, EE50 < 2.2 |
| 3 | UT03-1-008 | LRS g2 and g3 targets, Vsky > 20.7, EE50 < 4.0 |
| PSU03-1 | ||
|---|---|---|
| Rank | Program | Constraints |
| 1 | PSU03-1-011 3C59 | LRS G3, Vsky > 20.6 EE50 < 2.2 |
| 2 | PSU03-1-013 M31 | LRS G3 MOS, 1 long visit, Vsky > 20.3, EE50 < 1.8 |
| STA03-1 | ||
|---|---|---|
| Rank | Program | Constraints |
| 1 | STA03-1-002 Pstar 1024 | LRS G2, Vsky > 20.0 , EE50 < 2.0 |
| MUN03-1 | ||
|---|---|---|
| Rank | Program | Constraints |
| 1 | MUN02-3-001 S2F5c2-1E | LRS MOS, Vsky > 20.5, EE50 < 2.0, |
| 2 | MUN03-1-001 S6F5c2 | LRS MOS, Vsky > 20.5, EE50 < 2.0, |
| G03-1 | ||
|---|---|---|
| Rank | Program | Constraints |
| 1 | G02-3-004 | HRS, Synoptic target every 3-7 days for entire trimester, Vsky > 20.0 , EE50 < 3.0 |
The entire TAC agreed that the highest priority should be the Munich targets.
Rob asked to have UT03-1-008 added as third to the list of UT priorities.